Project Summary
In the spring of 2024, Tip of the Mitt Watershed Council contracted with Pickerel-Crooked Lakes Association to conduct a shoreline survey on both Crooked and Pickerel Lakes in the summer of 2024. This shoreline survey project is also funded in part by the Michigan Department of Environment, Great Lakes, and Energy’s (EGLE) Nonpoint Source Program by the United States Environmental Protection Agency. In 2021, the Watershed Council acquired funding from EGLE to address poor shoreline management and weak water resource protection ordinances. Thus, through funding generously provided by PCLA and EGLE, the shorelines of Crooked and Pickerel Lakes were fully surveyed and assessed for algal growth and density, erosion severity, degree of parcel development, shoreline alterations, and greenbelt status. Documenting this data, on an individual parcel status, expedites the understanding of inland lake shoreline conditions and their subsequent impact on water quality. The invaluable lake data generated via the shoreline survey can be used to assess long-term trends in shoreline health and protect and maintain the high-quality waters of Crooked and Pickerel Lakes.
For the full 2024 Pickerel-Crooked Lakes Shoreline Survey Report, click here.
Welcome to the 2024 Pickerel-Crooked Lakes Shoreline Survey Web App
How to use this tool: After closing this splash screen, type your Unique ID into the query box on the left side of the screen. Your individual property scores will populate in the same box. Below the query box, you can view the map legend and select the layers you want to view on the map for results around the lake. On the right side of the screen, you can view graphics for each category summarizing results from around the lake.
This project was completed with funds from Pickerel-Crooked Lakes Association and the Michigan Department of Environment, Great Lakes, and Energy’s Nonpoint Source Pollution (EGLE 319) Grant Program.
Greenbelt Scores
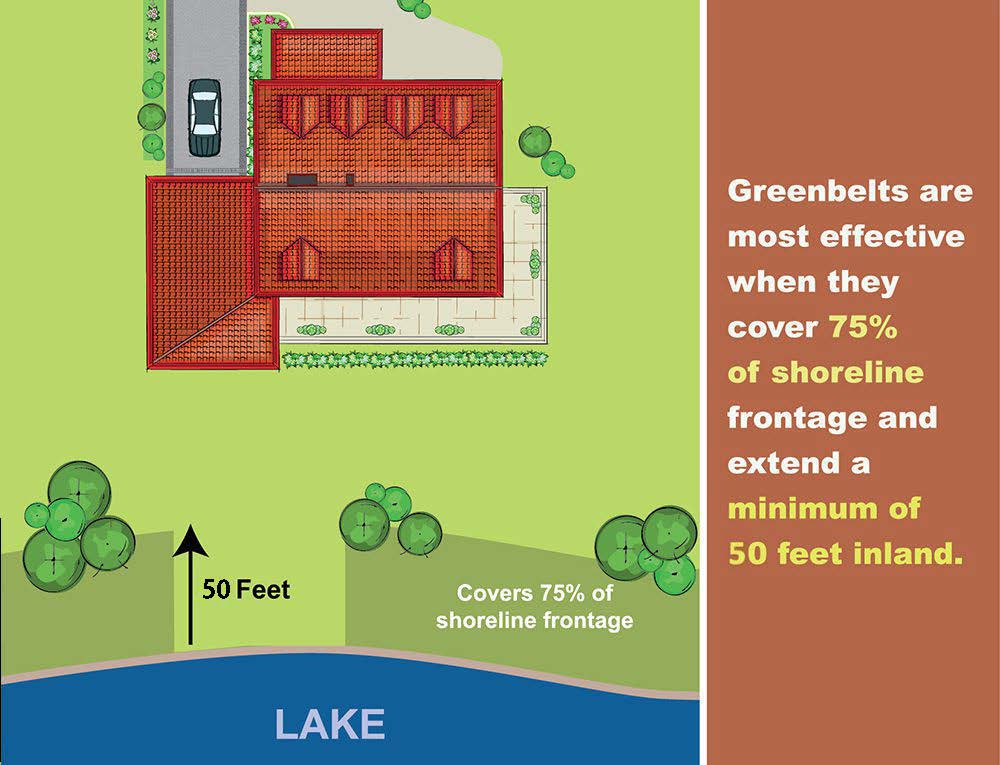
Table 8. Greenbelt Scoring Chart.
Score | Length (%) | Depth (feet) |
0 | Absent | Absent |
1 | <10% | <10 |
2 | 10-25% | 10-40 |
3 | 25-75% | >40 |
4 | >75% | N/A |
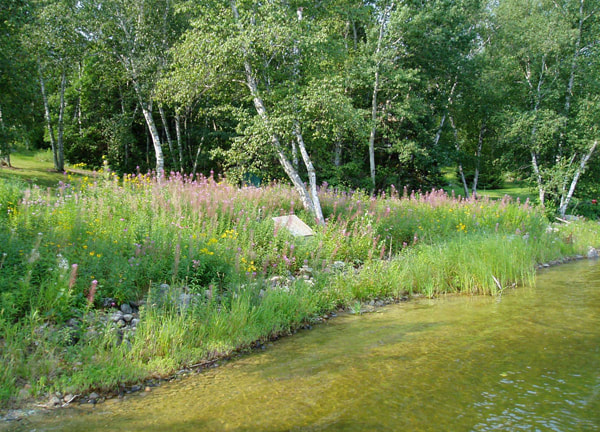
Greenbelt ratings for the length and depth of the vegetation were summed to produce an overall score describing the status, or health, of the greenbelt. Scores of 0 were considered very poor, 1-2: poor, 3-4: moderate, 5-6: good, and 7: excellent.
Erosion Severity
L = Exposed soils, gullies up to 1″ deep. |
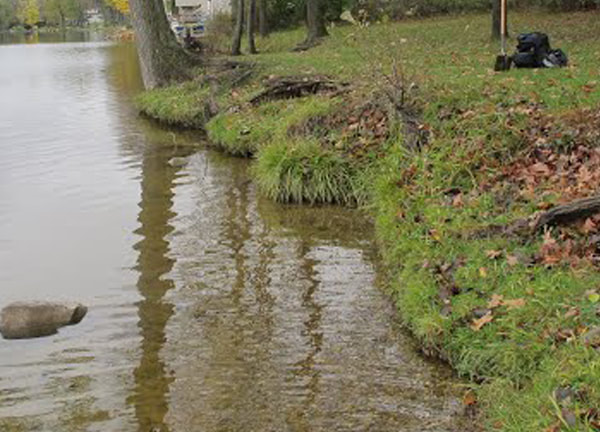
M = Exposed soils, gullies greater than 1″ but less than 6″ deep, and/or banks undercut by 6″ (minor slumping) |
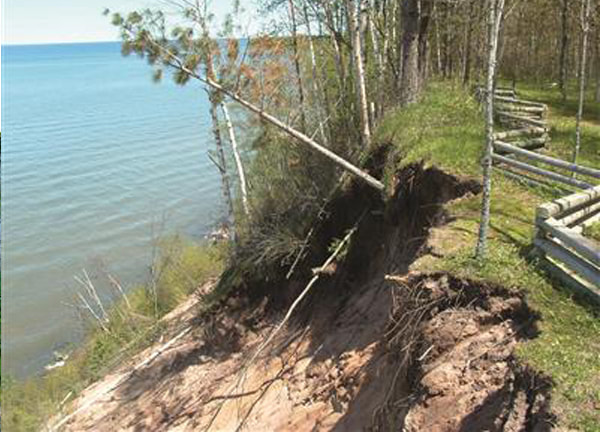
H = Exposed soils, gullies greater than 6″ deep, and/or banks undercut by more than 6″ (severe slumping) |
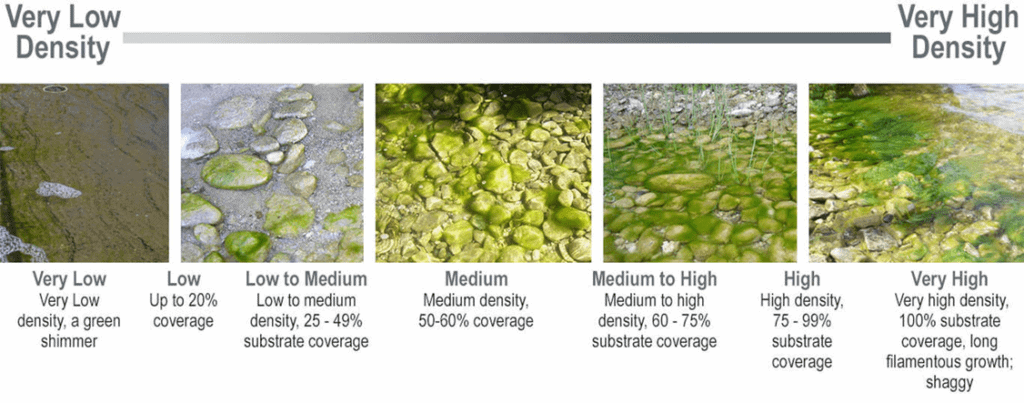
Cladophora Density
To improve your stewardship, visit the Michigan Shoreland Stewards (MiSS) website. The MiSS program provides recognition for lakefront property owners who are protecting inland lakes through best management practices on their property and provides recommendations for improving your shoreline
