Protecting Northern Michigan's ​Water Resources

Elk River Chain of Lakes Shoreline Survey

Project Summary

During the summers of 2016 and 2017, the Tip of the Mitt Watershed Council led a coordinated effort to conduct a shoreline survey for 15 Lakes in the Elk River Chain of Lakes Watershed. The surveys were meant to document conditions that could impact water quality, including the three biggest threats to inland lakes: nutrient pollution, habitat loss, and shoreline erosion.

Within the Watershed, shoreline properties have a large connection to the surrounding landscape and can serve as the last line of defense for protecting water quality. Conducted on a parcel-by-parcel basis, survey results indicate that human activity along sections of the shoreline of many Lakes is likely impacting the lake water quality to some extent. Importantly, Lake water quality remains quite high in all Lakes surveyed. The purpose of each survey was meant to identify areas of the shoreline that can be enhanced and improved to prevent nutrient pollution, erosion, increase fish habitat, and help protect and conserve the Elk River Chain of Lakes for future generations.

Improving areas with poor greenbelts will help the character and quality of your Lake by helping to reduce nutrient pollution and sediment input from erosion along the shoreline. Please visit the Michigan Shoreland Stewards (http://www.mishorelandstewards.org/) for more information on healthy lake practices along the shoreline.

Below are individual Lake reports for all lakes surveyed, highlighting greenbelt status, areas of erosion, and the presence of a bioindicator algae, known as “Cladophora”. Clicking a lake name will open the respective report in a new browser window. Please scroll beneath the lake list for a map depicting survey results. A legend for each map layer is shown by clicking the arrow next to the checked layer. Scroll down for information on greenbelts, Cladophora, and erosion from the survey. For individual parcel results, please contact Tip of the Mitt Watershed Council at (231)347-1181.

TitleLink
Comprehensive Water Quality Monitoring (CWQM)
2017 Torch Lake Shoreline Survey
2017 Thayer Lake Shoreline Survey
2017 Skegemog Lake Shoreline Survey
2017 Lake Bellaire Shoreline Survey
2017 Elk Lake Shoreline Survey
2017 Clam Lake Shoreline Survey
2016 Wilson Lake Shoreline Survey
2016 St. Clair Lake Shoreline Survey
2016 Six Mile Lake Shoreline Survey
2016 Intermediate Lake Shoreline Survey
2016 Hanley Lake Shoreline Survey
2016 Ellsworth Lake Shoreline Survey
2016 Ben Way Lake Shoreline Survey
2016 Beals and Scotts Lake Shoreline Survey
2010 Elk River Chain of Lakes Profile CWQM

Greenbelts

Greenbelts are a natural buffer of native vegetation between the water’s edge and your lawn that helps to reduce erosion by stabilizing the soil, filtering nutrients and other pollution. Greenbelts can also deter geese who prefer well-manicured lawns and unrestricted access to the water.

Greenbelt Scores

Greenbelts, i.e. strips of native vegetation, were characterized based on the length of shoreline they occupied, and the depth (in feet) that they extended from the shoreline landward into the parcel. Ratings for length ranged from zero to four while depth ranged from zero to three. Overall scores were based on the following categorizations:
 

Table 8. Greenbelt Scoring Chart.

Score

Length (%)

Depth (feet)

0

Absent

Absent

1

<10%

<10

2

10-25%

10-40

3

25-75%

>40

4

>75%

N/A

Greenbelt ratings for the length and depth of the vegetation were summed to produce an overall score describing the status, or health, of the greenbelt. Scores of 0 were considered very poor, 1-2: poor, 3-4: moderate, 5-6: good, and 7: excellent.

Erosion Severity

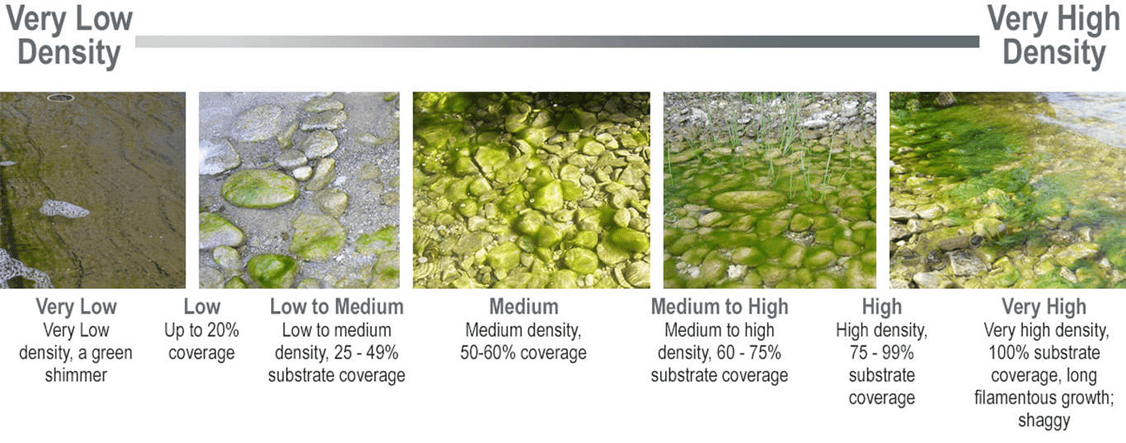
Erosion introduces sediments and excess nutrients attached to soil particles. An abnormal increase in sediments can clog the gills of fish, macroinvertebrates, and degrade habitat including fish spawning grounds. Increased nutrients can cause algal blooms that degrade lake water quality.

Picture


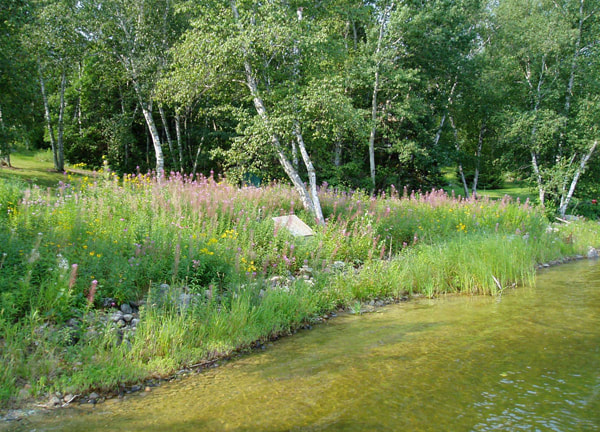
L = Exposed soils, gullies up to 1″ deep.

Picture

 
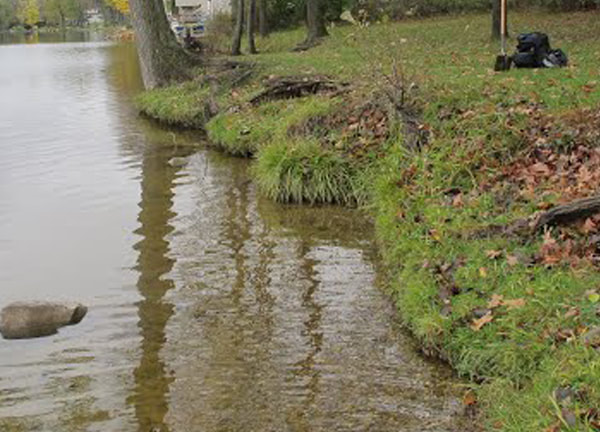
M = Exposed soils, gullies greater than 1″ but less than 6″ deep, and/or banks undercut by 6″ (minor slumping)

Picture

 
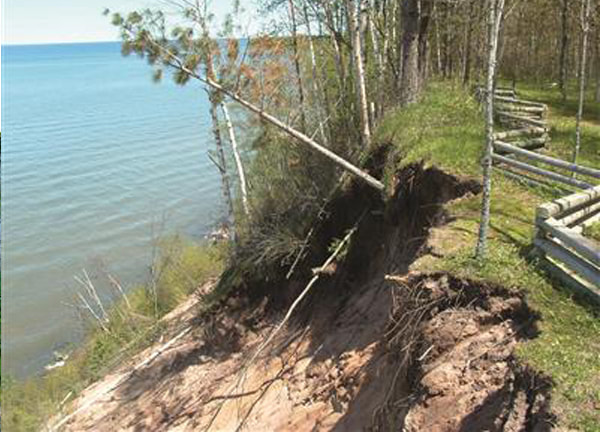
H = Exposed soils, gullies greater than 6″ deep, and/or banks undercut by more than 6″ (severe slumping)

Cladophora Density

Cladophora is an algae that grows as a film and in later growth stages as filaments on hard substrate near the shoreline. Increased nutrients, such as phosphorus from failing septic systems, enhance Cladophora growth to abnormal levels. Monitoring Cladophora serves as a useful bio-indicator of changes to nutrient inputs near the shoreline.
 

To improve your stewardship, visit the Michigan Shoreland Stewards (MiSS) website. ​The MiSS program provides recognition for lakefront property owners who are protecting inland lakes through best management practices on their property and provides recommendations for improving your shoreline