Project Summary
During the summer of 2017, the Black Lake Association (BLA) contracted with Tip of the Mitt Watershed Council to conduct a shoreline survey of Black Lake. The survey was designed to replicate and add parameters not reported in a similar 2005 survey. Conditions that can impact
water quality were documented in categories representative of the three biggest threats to inland lakes: nutrient pollution, habitat loss, and shoreline erosion. The shoreline assessment was conducted on a parcel by parcel basis around the entirety of Black Lake. Survey results
indicate that human activity around Black Lake shoreline is likely impacting the lake ecosystem and water quality to some degree.
For the full 2017 Black Lake Shoreline Survey Report, click here.
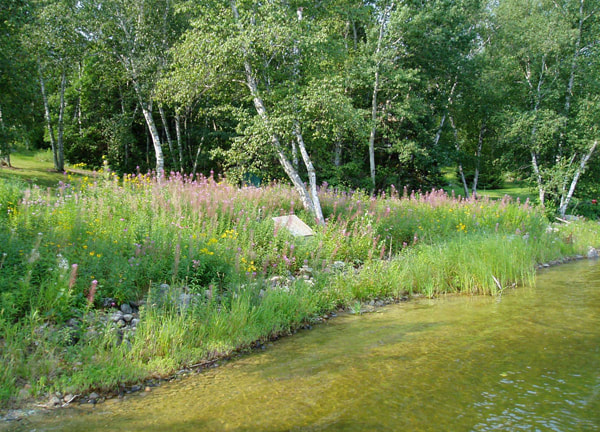
Improving areas with poor greenbelts will help the character and quality of your Lake by helping to reduce nutrient pollution and sediment input from erosion along the shoreline. Please visit the Michigan Shoreland Stewards (http://www.mishorelandstewards.org/) for more information on healthy lake practices along the shoreline.
Below are individual Lake reports for all lakes surveyed, highlighting greenbelt status, areas of erosion, and the presence of a bioindicator algae, known as “Cladophora”. Clicking a lake name will open the respective report in a new browser window. Please scroll beneath the lake list for a map depicting survey results. A legend for each map layer is shown by clicking the arrow next to the checked layer. Scroll down for information on greenbelts, Cladophora, and erosion from the survey. For individual parcel results, please contact Tip of the Mitt Watershed Council at (231)347-1181.
Greenbelt Scores
Table 8. Greenbelt Scoring Chart.
Score | Length (%) | Depth (feet) |
0 | Absent | Absent |
1 | <10% | <10 |
2 | 10-25% | 10-40 |
3 | 25-75% | >40 |
4 | >75% | N/A |
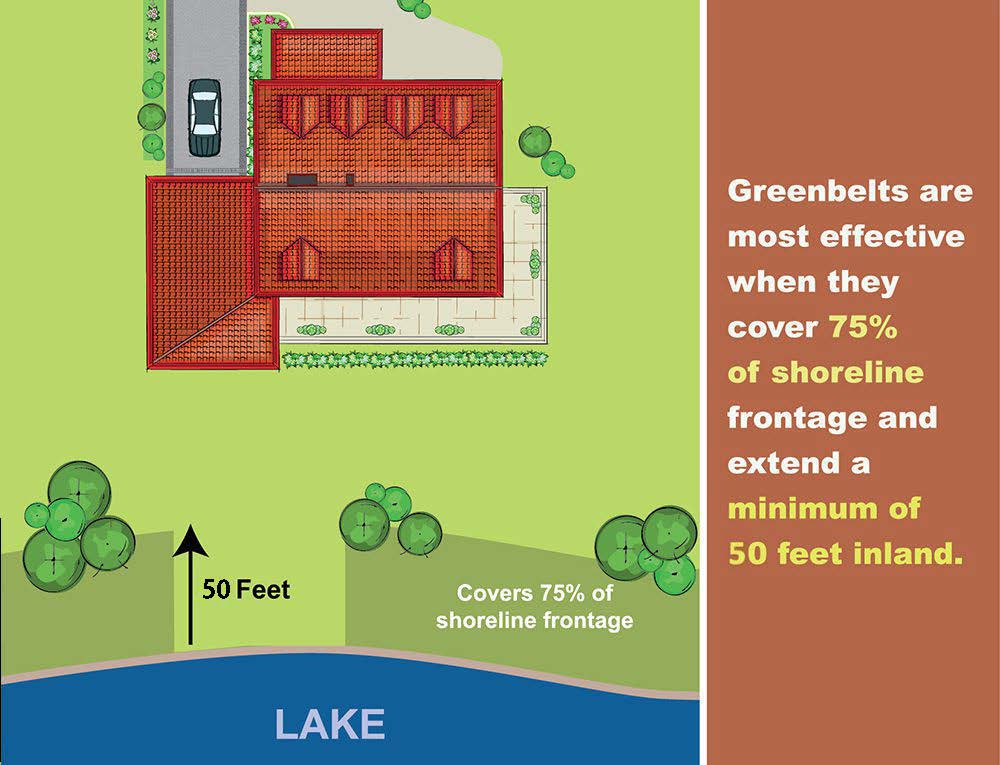
Greenbelt ratings for the length and depth of the vegetation were summed to produce an overall score describing the status, or health, of the greenbelt. Scores of 0 were considered very poor, 1-2: poor, 3-4: moderate, 5-6: good, and 7: excellent.
Erosion Severity
L = Exposed soils, gullies up to 1″ deep. |
M = Exposed soils, gullies greater than 1″ but less than 6″ deep, and/or banks undercut by 6″ (minor slumping) |
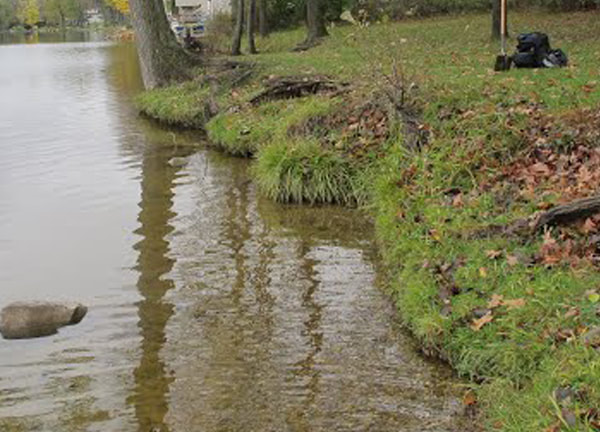
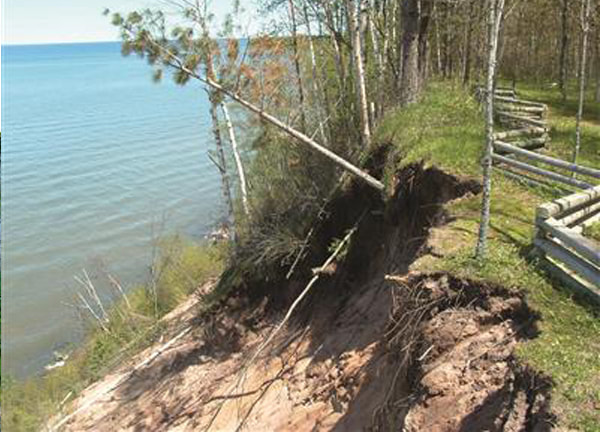
H = Exposed soils, gullies greater than 6″ deep, and/or banks undercut by more than 6″ (severe slumping) |
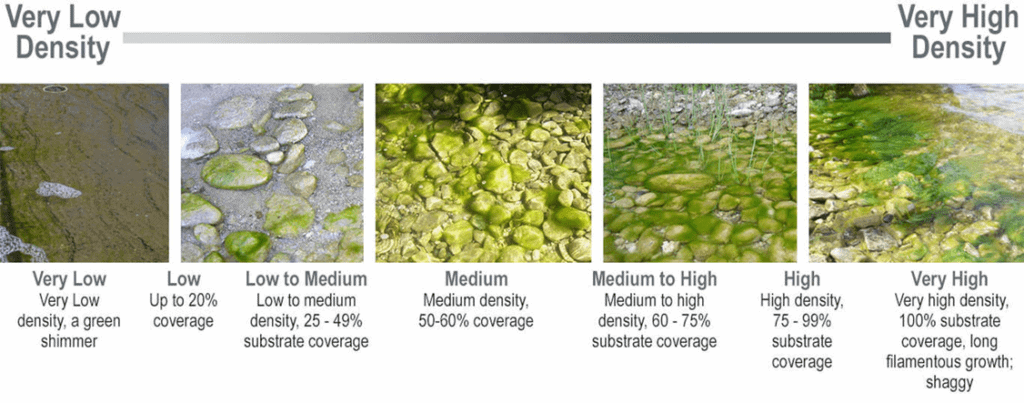
Cladophora Density
To improve your stewardship, visit the Michigan Shoreland Stewards (MiSS) website. The MiSS program provides recognition for lakefront property owners who are protecting inland lakes through best management practices on their property and provides recommendations for improving your shoreline
