Natural Influences on Water Levels
Hydrology
The water levels of the Great Lakes are determined by the amount of water flowing in and out of the lakes.
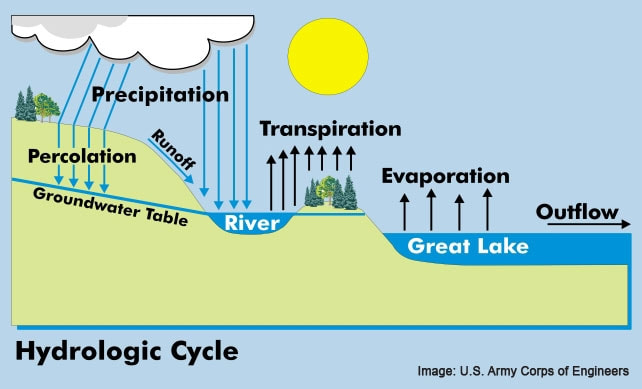
Water moves through the environment in a continuous cycle. Water evaporates from surface water bodies such as lakes, streams, the Great Lakes, and oceans. The water vapor condenses to form clouds and this moisture returns to the earth as precipitation. Precipitation, either rain or snowmelt, falls back to the earth. Some of the water falls directly into surface bodies of water; some runs off the land surface into streams and lakes and becomes surface water. A large proportion of the water, however, seeps into the ground. Water that seeps below the surface is called groundwater. Some groundwater is taken up by trees and other vegetation and released to the atmosphere though transpiration. The rest of the groundwater eventually flows into a surface water body to begin the cycle anew.
This hydrologic cycle determines water supply to the Great Lakes Basin. Very simply, water inflow (precipitation, runoff, and water from streams and groundwater) minus water outflow (evaporation and water flowing out of the system) equals a change in lake water levels.
Climate
Changes in water supply are driven by climatic factors and weather patterns like precipitation and temperature. In general, continuous wet and cold years will cause water levels to rise. Conversely, consecutive warm and dry years will cause water levels to decline. Long-term changes in water levels are usually a result of higher or lower precipitation (rain and snow) and evaporation rates. Precipitation anywhere in the Great Lakes Basin, whether over the water or somewhere inland, will end up in the Great Lakes. Sufficient precipitation will raise their levels. Lower precipitation leads to lower runoff from the Basin causing lake levels to decline. Evaporation draws water from the lakes causing levels to decline. Evaporation is greatest when the temperature difference between the water and the air is greatest. Such conditions occur in the fall, when the air has cooled but the water still retains some of the heat gained during the summer. If ice cover is not significant, the open water continues to lose vapor to the dry winter air, dropping water levels even more.
In particular, Great Lakes water levels are especially influenced by winters: a hard winter, with above normal snowfall and bitter cold temperatures creating vast ice cover will cause lake levels to rise, whereas mild winters with higher temperatures and, subsequently, less ice cover and more evaporation will decrease lake levels. Heavy rains and snow in the early 1970s and 1980s raised the water levels of the Great Lakes to above average. In contrast, a decade of warm winters with sporadic snowfall resulted in the prolonged period of low water experienced between 1999 and 2014.
Glacial Rebound
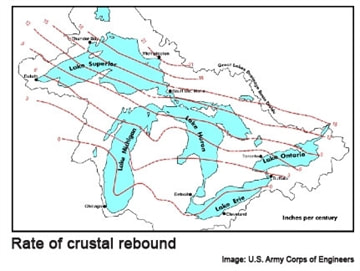
Glacial or isostatic rebound in the Great Lakes region is an effect of the last Ice Age, a response of the earth to the great mile-thick ice sheets that covered the area 18,000 years ago. Without the immense weight of the glaciers, the land is able to rebound. Essentially, the land that was depressed and pushed down under the weight of the mass of ice is now rising in elevation. The land in the Great Lakes Basin continues to rise by a few inches every 100 years. However, the rising is not uniform; the northern and eastern shores rise more rapidly than the land along the southern and western shores. As a result, the water level on one side rises, but falls on the other side. The rebounding lands do not change the total volume of water in the Great Lakes Basin, however, it can affect the availability of water in certain areas. In a way, the lakebeds in the Great Lakes are tilting and such tilting of one end of a lake Basin higher than another causes water to pile up at the southern end of the Basin. Over a century, this factor alone can cause water levels to rise the better part of a foot.
Human Influences on Water Levels
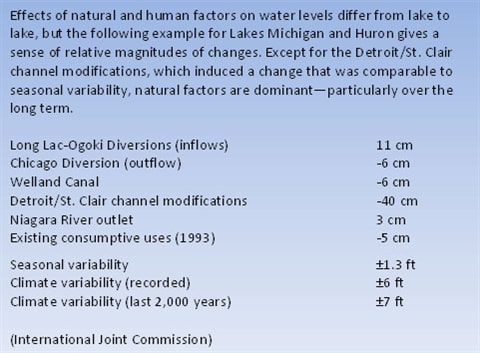
While climate and weather patterns are the primary driver of Great Lakes water levels, there are other man-made forces that also influence water levels. Several human activities have affected levels and flows of the Great Lakes over the years. In addition to intentionally regulating water levels, man-made alterations, including dredging, diversions, and water withdrawals, have unintended consequences to the water levels of the Great Lakes. However, human effects on lake levels have been relatively small compared to the changes caused by the natural factors.
Climate Change
While the primary reasoning for low lakes levels is natural weather conditions, it is also widely accepted that global warming either will or is already dramatically altering what would otherwise be a natural occurrence.
The Earth’s climate has changed in the past and will continue to change naturally in the future. The problem arises when the warming trends we are facing are actually accelerated and caused by humans rather than by natural occurrences. Global warming is caused by the emissions of greenhouse gases, such as carbon dioxide, which form a layer in the atmosphere and trap solar energy. Most scientists now agree that average temperatures are rising and if we do not curb the rise in emissions, we will face serious consequences. While there is no direct evidence of global warming based upon U.S. Army Corps of Engineers lake level analyses, there are other indications that climate change is occurring within the Great Lakes Basin.
There has been a significant decrease in ice cover in the Great Lakes. The loss of Great Lakes ice has allowed more water to evaporate in winter, resulting in heavier lake effect snow near the shore, and lower lake levels. Overall, the Great Lakes have lost 71% of their ice cover since 1973, according to a study by the Great Lakes Environmental Research Laboratory (GLERL). Lake Ontario saw an 88% decline in ice cover, Superior lost 79% of its ice, Michigan lost 77%, Huron lost 62%, and Erie lost 50%. The loss of ice is due to increasing air and water temperatures.
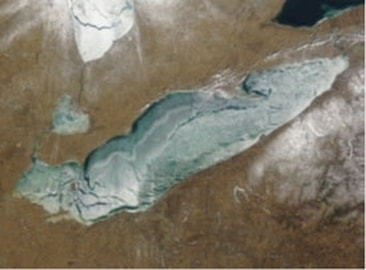
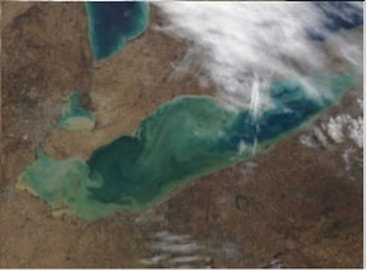
MODIS satellite photos showing Lake Erie ice cover on March 4, 2009 (left) and March 10, 2012 (right).
Credit: GLERL
Additionally, the Great Lakes are thawing earlier each spring, according to an analysis of ice break-ups dating back to 1846. A team from the University of Wisconsin-Madison studied the timing of ice break-ups on 61 lakes in Minnesota, Wisconsin, Michigan, New York, and Ontario between 1975 and 2004, during which time the average global air temperature rose by 0.4 degrees Celsius. On 56 of the lakes, the spring thaw occurred, on average, two days earlier each decade. Although the thaw has been happening earlier ever since 1846, the rate of change is now more than three times as fast as it was before 1975.
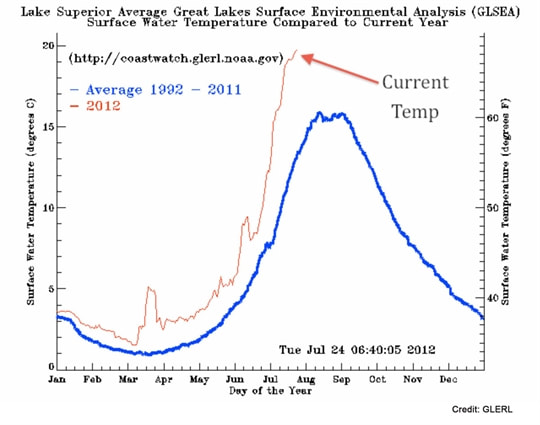
Due to decreased lake ice cover along with warmer-than-average weather, data shows a long-term warming trend throughout the Great Lakes for water temperatures. Based on data from the Great Lakes Environmental Research Laboratory (GLERL) the average temperatures on each of the Great Lakes are running around 2 to 3 degrees above normal. Lake Superior, the northernmost, coldest, and deepest of the five Great Lakes, is the warmest it has been in at least a century.
In addition to water temperature rises, scientists expect average temperatures in the Great Lakes Basin to warm by 5 to 10 degrees Fahrenheit by the end of the 21st century. The rise in temperature will cause lake water levels to fall due to increased evapotranspiration, the water lost to the atmosphere by evaporation and transpiration.
Regulation of Water Levels
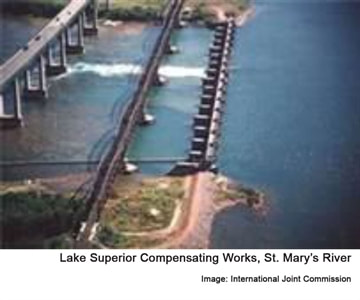
The International Joint Commission (IJC), a bi-national organization charged with shaping policy for U.S. and Canadian waterways, is responsible for managing and regulating levels of some of the Great Lakes. There are currently limited controls of levels and flows for Lakes Superior and Ontario through a system of locks and dams on the St. Marys River and in the St. Lawrence. The basic goal of the regulation is to set the flow that will result in Lake Superior and Lake Michigan-Huron staying at nearly the same relative position within their natural range of fluctuation.
Lake Superior has been regulated since 1921 as a result of hydroelectric and navigation developments and Lake Ontario has been regulated since 1960 after completion of the St. Lawrence Seaway and Power Project. While these regulations can alter and alleviate lake level extremes, the current regulations of lake levels do not affect long-term lake level trends and cannot influence levels significantly in the short term.
Dredging in the St. Clair River
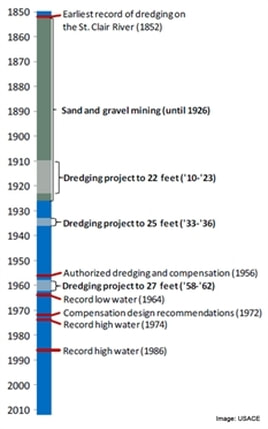
Dredging in the St. Clair River began in the 1850’s for navigational purposes and continued until the last major dredging project took place in 1962. The U.S. Army Corps of Engineers (USACE) dredged the river to a depth of 27 feet, deepening the channel by 2 feet, to accommodate freighters. Some believe that Lake Michigan-Huron are losing vast amounts of water because of erosion from this dredging project. The Army Corps fully acknowledged that the dredging would result in a permanent loss of approximately 16 inches from Lakes Michigan and Huron, but the loss was to be a one-time drop in water levels.
A Canadian conservation group created by property owners from northern Lake Huron’s Georgian Bay hired an engineering firm, W.F. Baird & Associates, to conduct a study of what was going on in the St. Clair River back in 2004. That study said the water lost from the lakes by expanding the river channel was actually much greater than 16 inches – and getting worse. The study concluded that an Army Corps dredging project had exposed the riverbed to severe ongoing erosion that helped trigger massive increasing water loss from Lake Michigan- Huron.
Click here to read the W.F. Baird & Associates Report Regime Change (Man Made Intervention) and ongoing erosion in the St Clair River and Impacts on Lake Michigan-Huron Lake Levels.
A 5-year investigation was launched by the International Joint Commission in 2007 to determine why water levels in the upper Great Lakes decreased to record lows and what should be done, if anything, to prevent further decline. The investigation, the International Upper Great Lakes Study (IUGLS), was divided into two parts. The St. Clair River part of the Study was established to address widespread concerns among governments at all levels, property owners, and other interests about the long term economic and environmental effects of low water levels in the upper Great Lakes. The first of two major reports presented the findings and recommendations pertaining to the St. Clair River.
The International Upper Great Lakes Study (IUGLS) report, Impact on Upper Great Lakes Water Levels: St. Clair River, found that unexpected erosion did, in fact, occur on the St. Clair River, but that the additional loss of water that resulted was only 3-5 inches. The study also concluded that there is not ongoing erosion in the river and there has been no significant erosion of the channel in the upper reach of the St. Clair River bed since at least 2000. As a result, the Study Board concluded that remedial measures to address changes in the St. Clair River since the navigational dredging in 1962 are not warranted at this time.
Diversions
A diversion is any transfer of water from one watershed to another. Diversions may transfer water in or out of the Great Lakes Basin, or between the watersheds of different lakes or rivers within the Basin. While the impacts of existing diversions on lake levels are minor, they alter the natural flow of the Great Lakes and water returned from diversions may be of a different quality than when it was withdrawn.
There are 4 major diversions in the Great Lakes Basin. The Long Lac and Ogoki diversions into Lake Superior from the Albany River system in northern Ontario are the only major diversions into the Basin. The Chicago diversion from Lake Michigan into the Mississippi River system is the only major diversion out of the Great Lakes Basin. The Welland Canal diverts water between subbasins of the Great Lakes and is considered an intrabasin diversion. Aside from these major diversions, there are also a few small diversions.
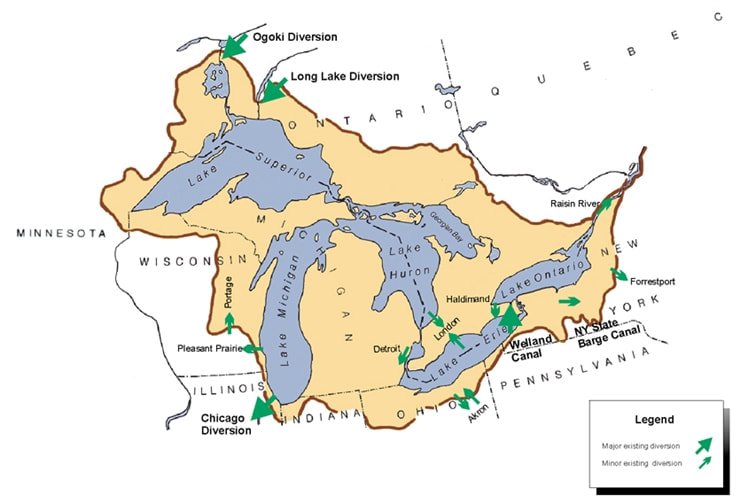
According to the U.S. Army Corps of Engineers, the cumulative impacts of all of these diversions have raised water levels on Lake Superior by less than 1 inch, had no measurable effect on Lakes Michigan-Huron, lowered Lake Erie by almost 4 inches and raised Lake Ontario by less than 1 inch.
The diversion of Great Lakes water to locations both inside and outside of the Great Lakes Basin has been source of concern and questions for many years. The Chicago diversion is the largest and best known out-of-basin diversion of the Great Lakes. Water has been diverted from Lake Michigan at Chicago since 1848. Until 1900, water diverted from Lake Michigan averaged about 500 cubic feet per second (cfs).
In the early 1880s, Chicago realized there were problems with the city disposing of its wastewater into Lake Michigan, its source of drinking water. Raw sewage and heavily polluted water that flowed into Lake Michigan via the Chicago River was causing severe outbreaks of waterborne disease. In 1895, a major outbreak of cholera killed 90,000 residents. New canals were constructed in 1900 and this allowed the City of Chicago to reverse the flow of the Chicago River so that instead of flowing into Lake Michigan, it flowed out of Lake Michigan toward the Mississippi River system. This allowed the polluted waste to be taken away from the drinking water source.
The original permit for the diversion allowed a maximum water withdrawal of 4,167 cubic feet per second for domestic, sanitary, and navigation purposes. The maximum volume of Great Lakes water diverted has changed over the years. In 1967, the U.S Supreme Court capped the diversion at 3,200 cubic feet per second per day— its current level. Actual annual flows have at times exceeded this amount. However, since 1994, diverted flows have been reduced below 3,200 cfs in an effort to maintain a long term average of 3,200 cfs or less. The increased outflow through the Chicago Diversion has lowered the water level of Lake Michigan-Huron by two and a half inches.
However, at present, more water is diverted into the Great Lakes Basin through the Long Lac and Ogoki diversions than is diverted out of the Basin at Chicago and by several small diversions.
During the 1940s, two diversions into the Lake Superior basin were completed at Long Lac and Ogoki in Ontario, Canada. Today the Long Lac and Ogoki diversions continue to provide hydropower generation capability to northern Ontario. The Long Lac and Ogoki diversions represent approximately 6 percent of the supply to Lake Superior. Combined, the flow of water in the Long Lac and Ogoki diversions averages 5,400 cubic feet per second. The hydrologic effect of these diversions increased the net supply of water to the Great Lakes. The mean level of Lake Superior has been increased by 3 inches, Lakes Michigan-Huron by 4 inches, Lake Erie by 3 inches, and Lake Ontario by 3 inches.
The Long Lac and Ogoki diversions divert into Lake Superior 2,000 cubic feet per second greater than the amount of water diverted out of Lake Michigan at Chicago. Therefore, the net total of all the inter-basin diversions in the Great Lakes shows more water diverted into the lakes than out. This makes the Chicago and other smaller diversions of water from the Great Lakes currently negligible.
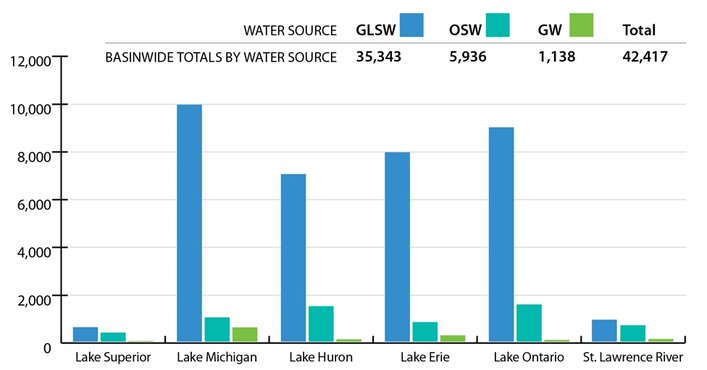
Water is taken from the Great Lakes Basin for a variety of reasons – for drinking, bathing, laundry, agriculture, industry, and so much more. According to the Great Lake Commission Annual Report of the Great Lakes Regional Water Use Database Representing 2014 Water Use Data, the total reported withdrawal amount for the Great Lakes-St. Lawrence River Basin, excluding in-stream hydroelectric water use was 44,493 million gallons per day (mgd). This total represents a five percent increase from the 2013 reported withdrawal amount total of 42,380 mgd.
The Lake Michigan watershed has the greatest withdrawal, followed by Lakes Ontario and Erie, respectively. The graph below shows withdrawals by watershed broken down by water source, e.g., Great Lakes surface water (GLSW), other surface water (OSW) and groundwater (GW).
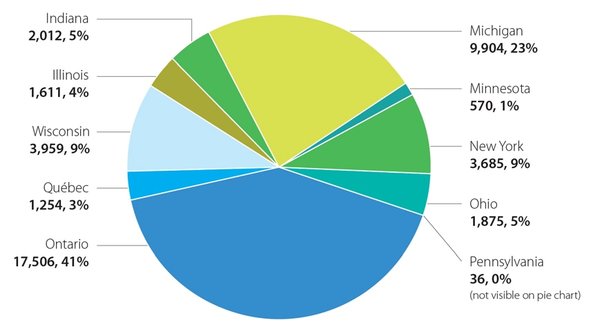
The pie chart below shows total withdrawals portioned by jurisdiction, excluding in-stream hydroelectric water use. Ontario, with a land area spanning five watersheds (i.e., lake basins) was the largest withdrawer of Great Lakes water at 17,506 mgd or 39 percent of the total withdrawal amount. In contrast, Pennsylvania, with a land area of 508 square miles within the Lake Erie watershed, withdrew just 36 mgd.
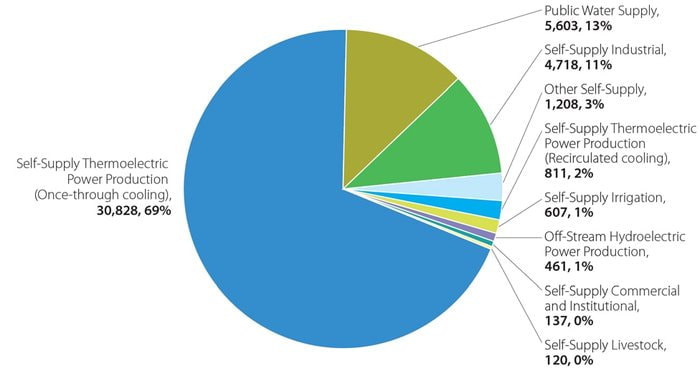
Approximately 5 ½ % of the water that is withdrawn from the Great Lakes watershed is consumed and is lost from the Basin. In 2014, the total reported consumptive use for the Basin was 2,490 mgd – an increase of 158 mgd or nearly 7 percent from the 2013 total consumptive use amount of 2,333 mgd. The public water supply at 720 mgd and industrial at 736 mgd were primary contributors to the total consumptive use amount. However, at this time, the 5 ½ % of water lost does not appear to be placing significant pressure on the Great Lakes.